
When a 50-metre building meets a 10 m/s wind, the ground-level pedestrian doesn't feel 10 m/s. They feel more at the corners (Venturi acceleration) and less in the wake (shelter). The difference between a pleasant café terrace and an unusable plaza often comes down to a factor of 2× in local wind speed — and that factor is entirely predictable with CFD.
This is the study that every urban development, every tall-building planning application, and every outdoor-comfort assessment needs. And it runs in under 10 minutes.
The Setup
Geometry: A single rectangular tower (30 × 20 × 50 m) on flat terrain — the simplest case that demonstrates all the critical phenomena.
Atmospheric boundary layer inlet: A logarithmic velocity profile models the real wind approaching the building:
$$U(z) = \frac{U_*}{\kappa} \ln\left(\frac{z + z_0}{z_0}\right)$$
with U_ref = 10 m/s at 50 m height, roughness length z₀ = 0.1 m (suburban terrain), and matching turbulent kinetic energy and dissipation profiles. OpenFOAM-7's atmBoundaryLayerInletVelocity + atmBoundaryLayerInletK + atmBoundaryLayerInletEpsilon boundary conditions handle this natively.
AuraMesh automatically sizes the domain to wind-engineering standards (10H upstream, 20H downstream, 5H lateral, 5H above), activates the ground plane, and adds wake and underbody refinement zones.
Solver: simpleFoam with k-ε turbulence (standard for wind engineering ABL studies).
Result: 270,108 cells. Converged in 538 iterations. Total wall time: 8 minutes.
The Pedestrian-Level Map
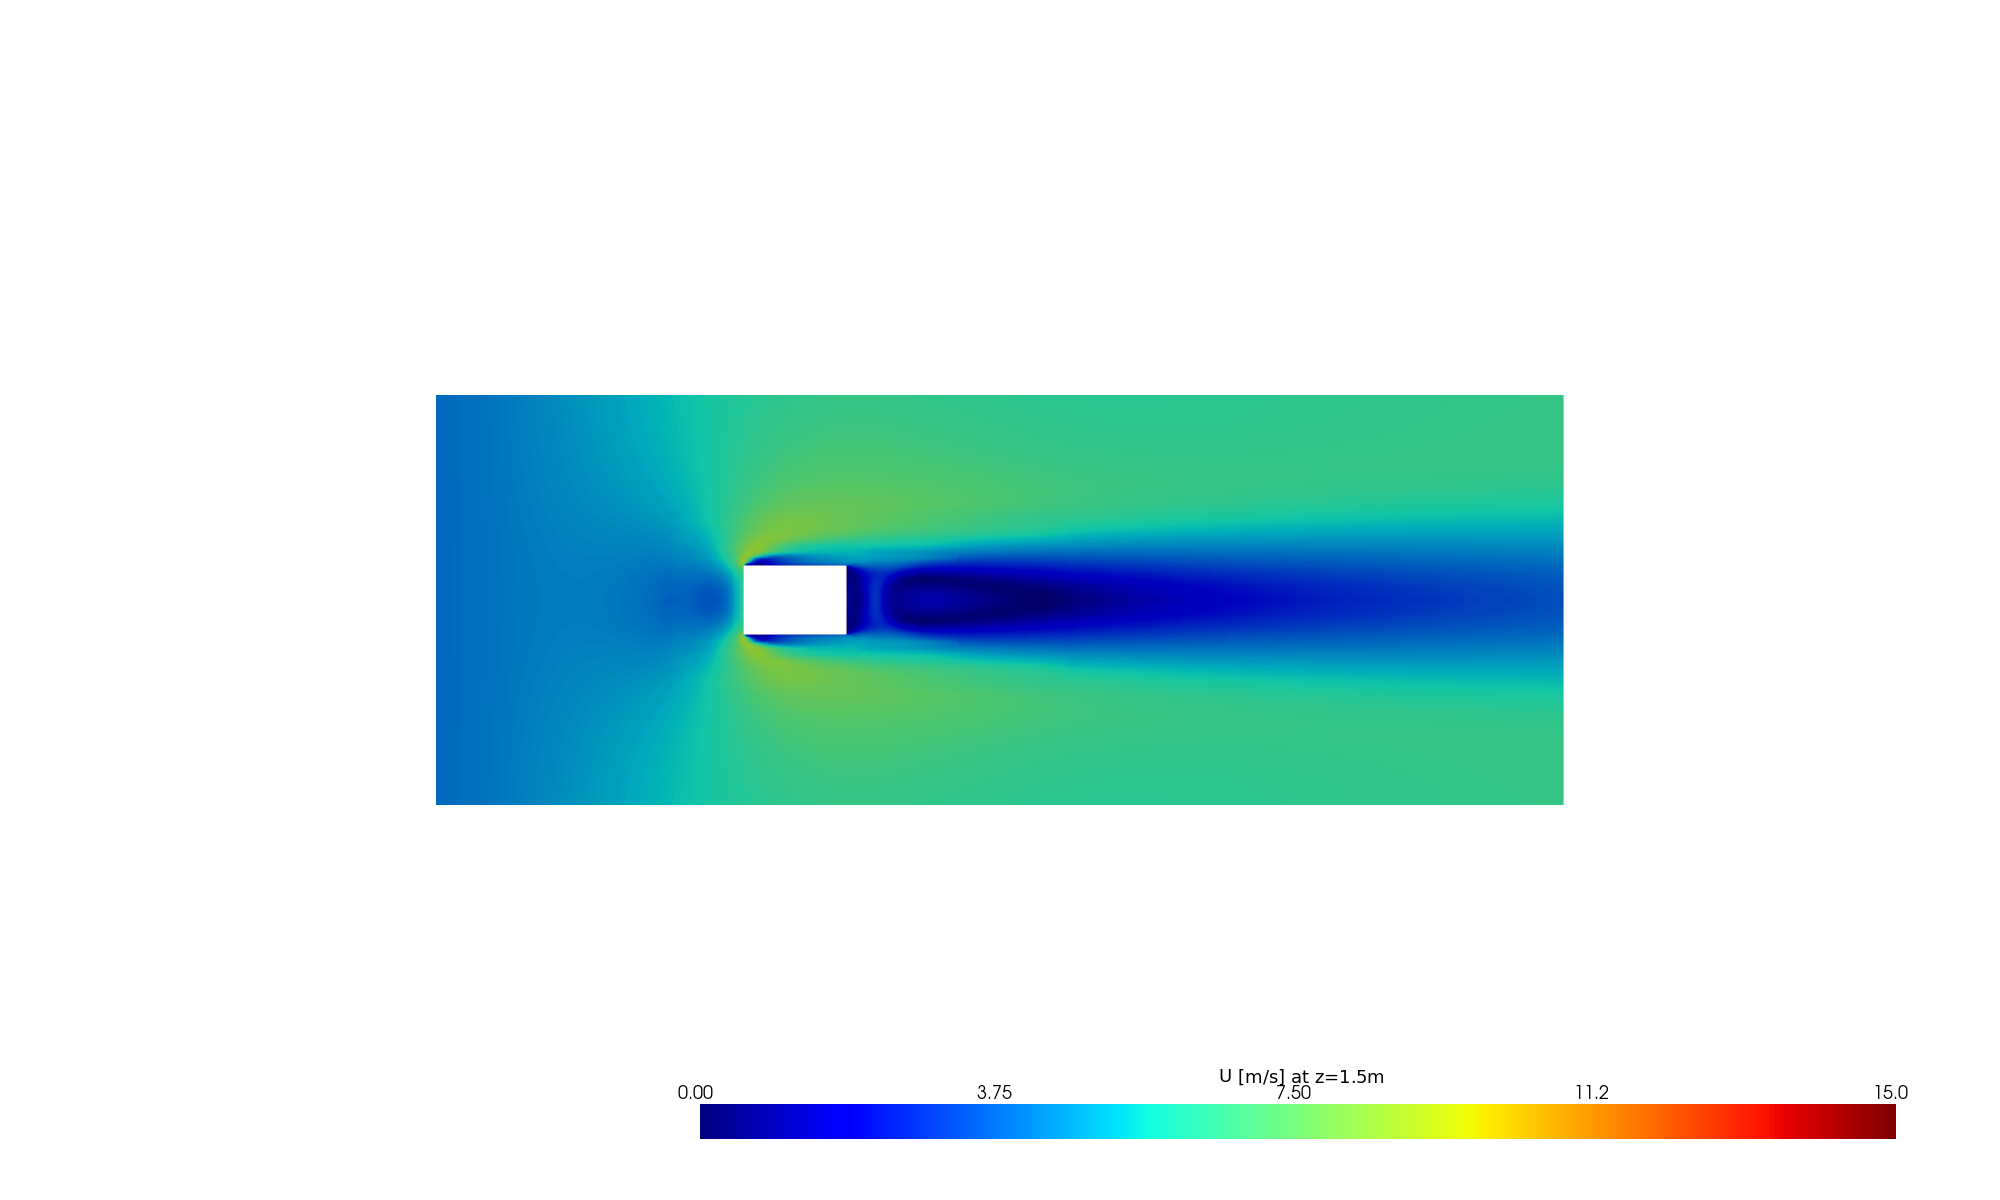
This is the money shot for any wind comfort study. The horizontal slice at z = 1.5 m — pedestrian head height — reveals:
- Corner acceleration (green-yellow bands, 8–12 m/s): wind funnelling around the building edges, exceeding the freestream by 20–40%. This is where outdoor seating becomes uncomfortable and signage gets damaged.
- Wake shelter zone (dark blue, < 3 m/s): the recirculation region directly behind the building where wind speed drops to near-zero. Protected, but potentially stagnant (poor pollutant dispersion).
- Upstream stagnation (blue arc in front): the horseshoe vortex footprint where approaching flow decelerates and deflects.
- Lateral freestream (uniform green): undisturbed flow far from the building, at the expected ABL profile value for z = 1.5 m.
In a real project, this map is overlaid on the site plan and compared against the Lawson comfort criteria (sitting: < 4 m/s, standing: < 6 m/s, walking: < 8 m/s) to determine which areas are suitable for which activities.
Vertical Structure — What Happens Overhead
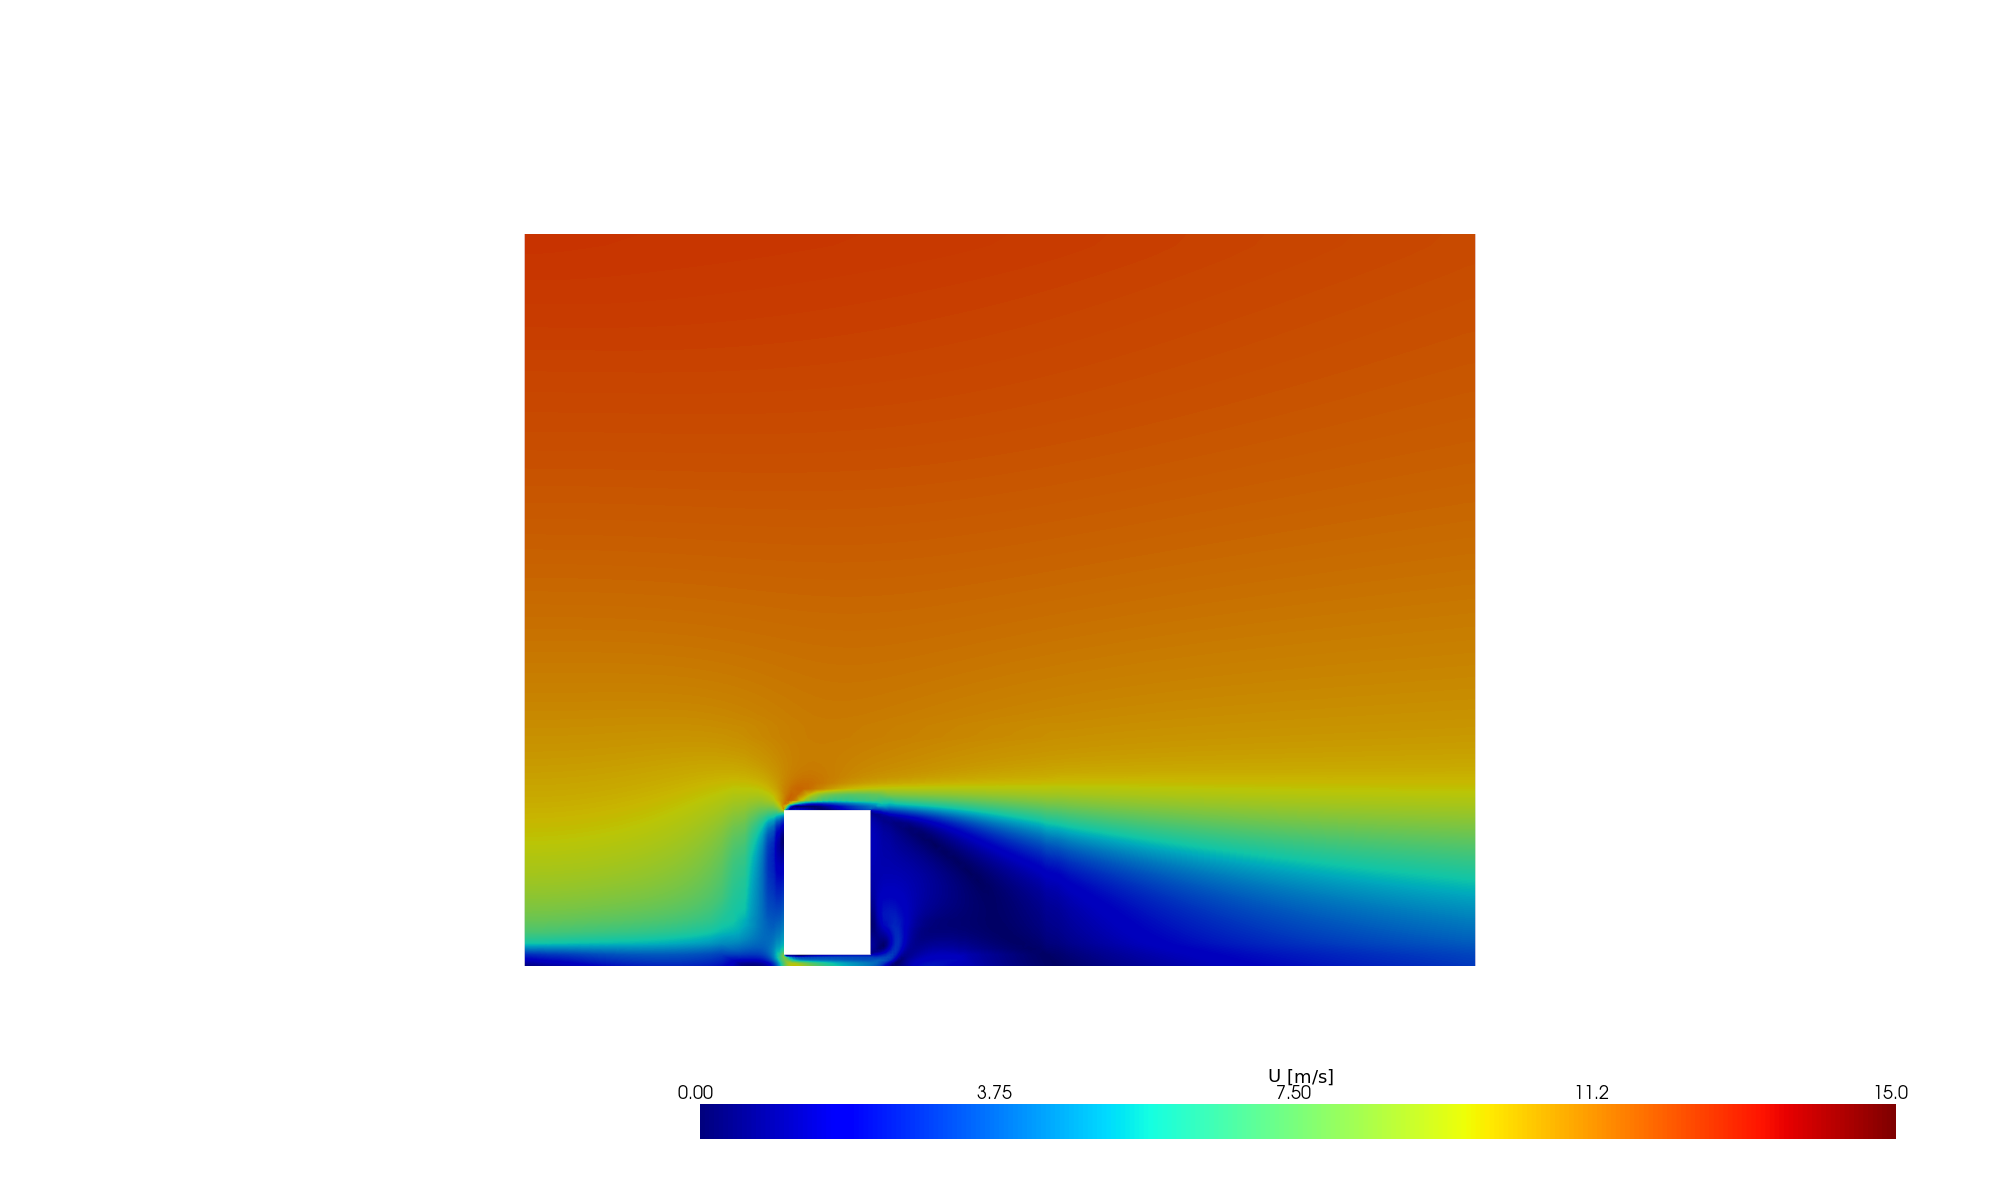
The vertical centerplane tells the three-dimensional story:
- The atmospheric boundary layer is visible as the red-to-green vertical gradient at the inlet (fast aloft, slow near ground)
- Rooftop separation: flow accelerates over the roof edge and separates — the local speed-up here can exceed 1.5× freestream
- Wake recirculation: the large blue region behind the building where reversed flow creates a closed eddy. Its length (~3–5H downstream) determines how far the shelter extends
Pressure on the Facades
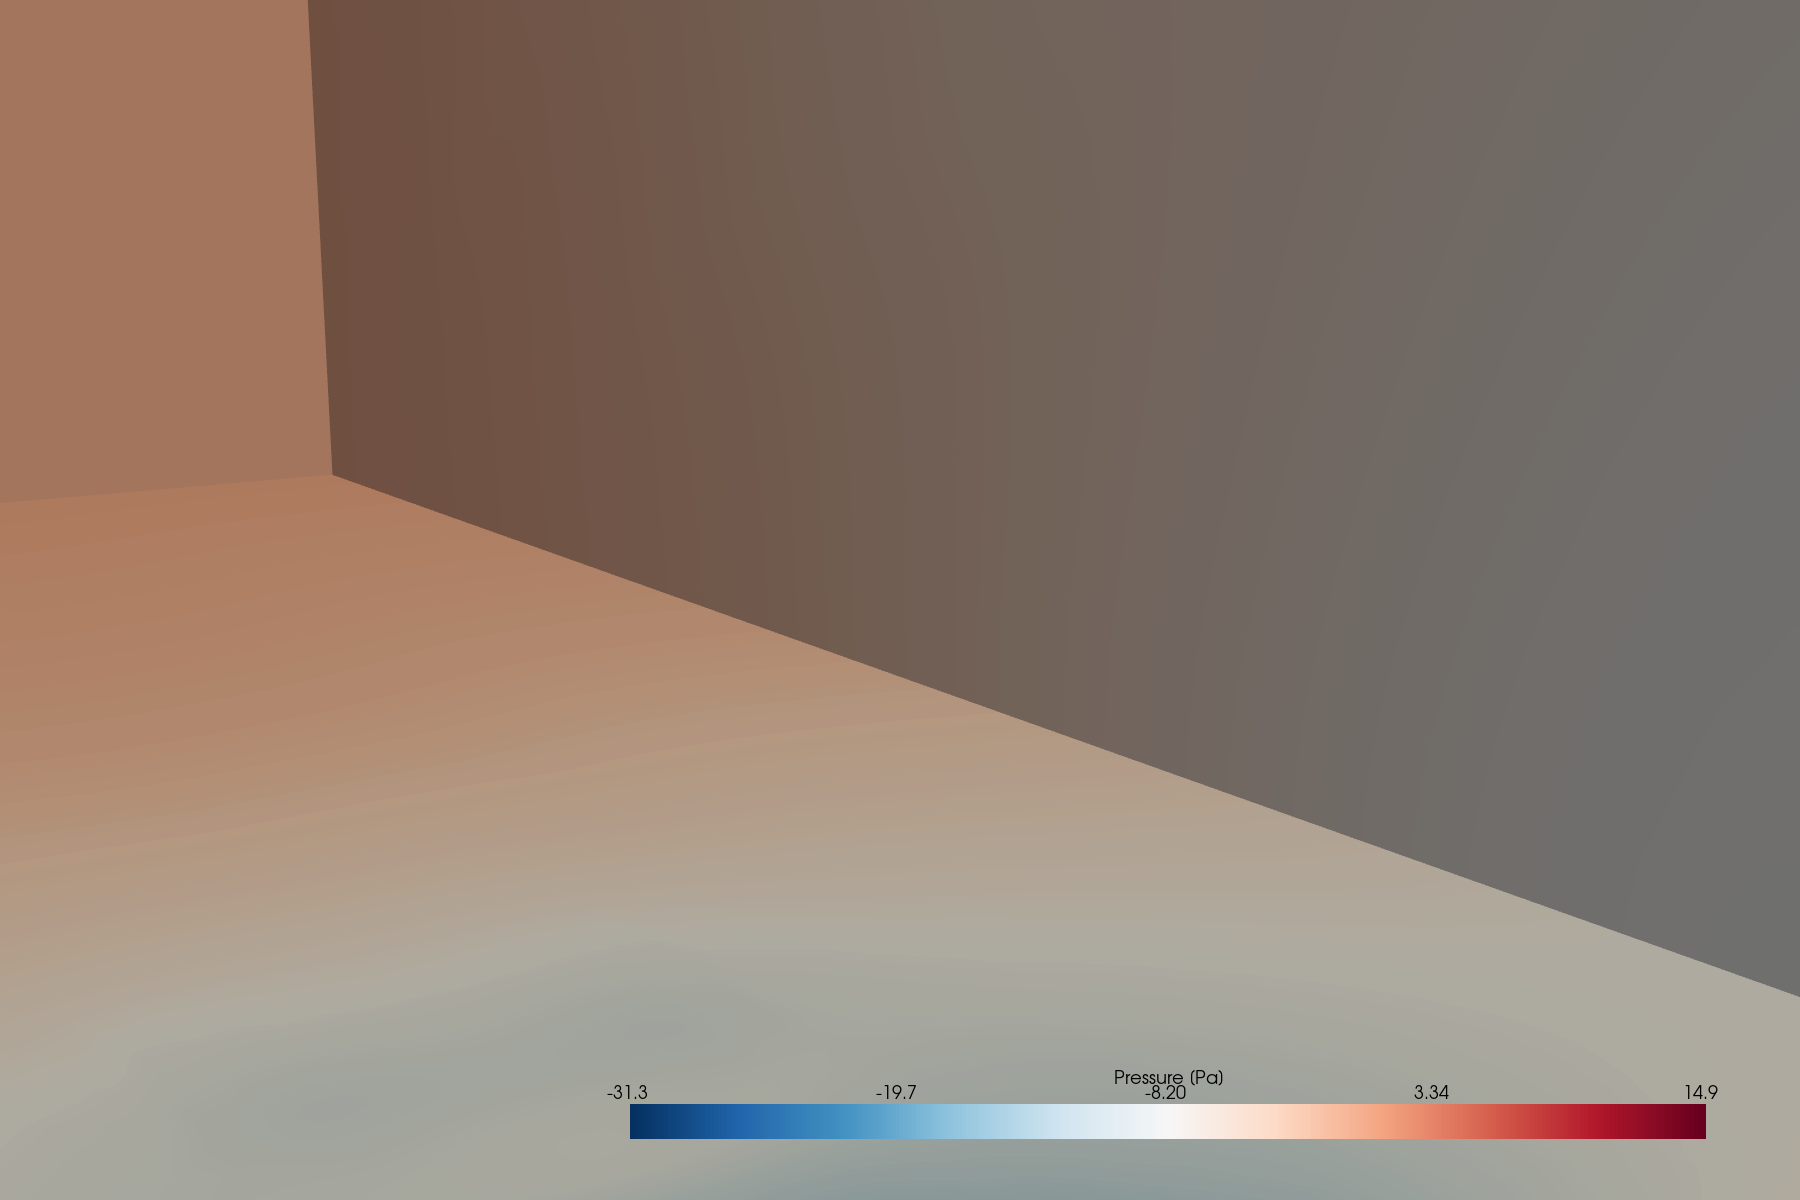
The facade pressure drives structural wind loads and natural ventilation calculations. The windward face sees stagnation pressure (positive Cp ≈ 0.8 at 2/3 height), while the leeward face and roof see suction (negative Cp ≈ -0.5 to -0.3). The pressure difference across the building is what drives wind through any openings — critical for naturally ventilated designs.
3D Streamlines — The Complete Picture
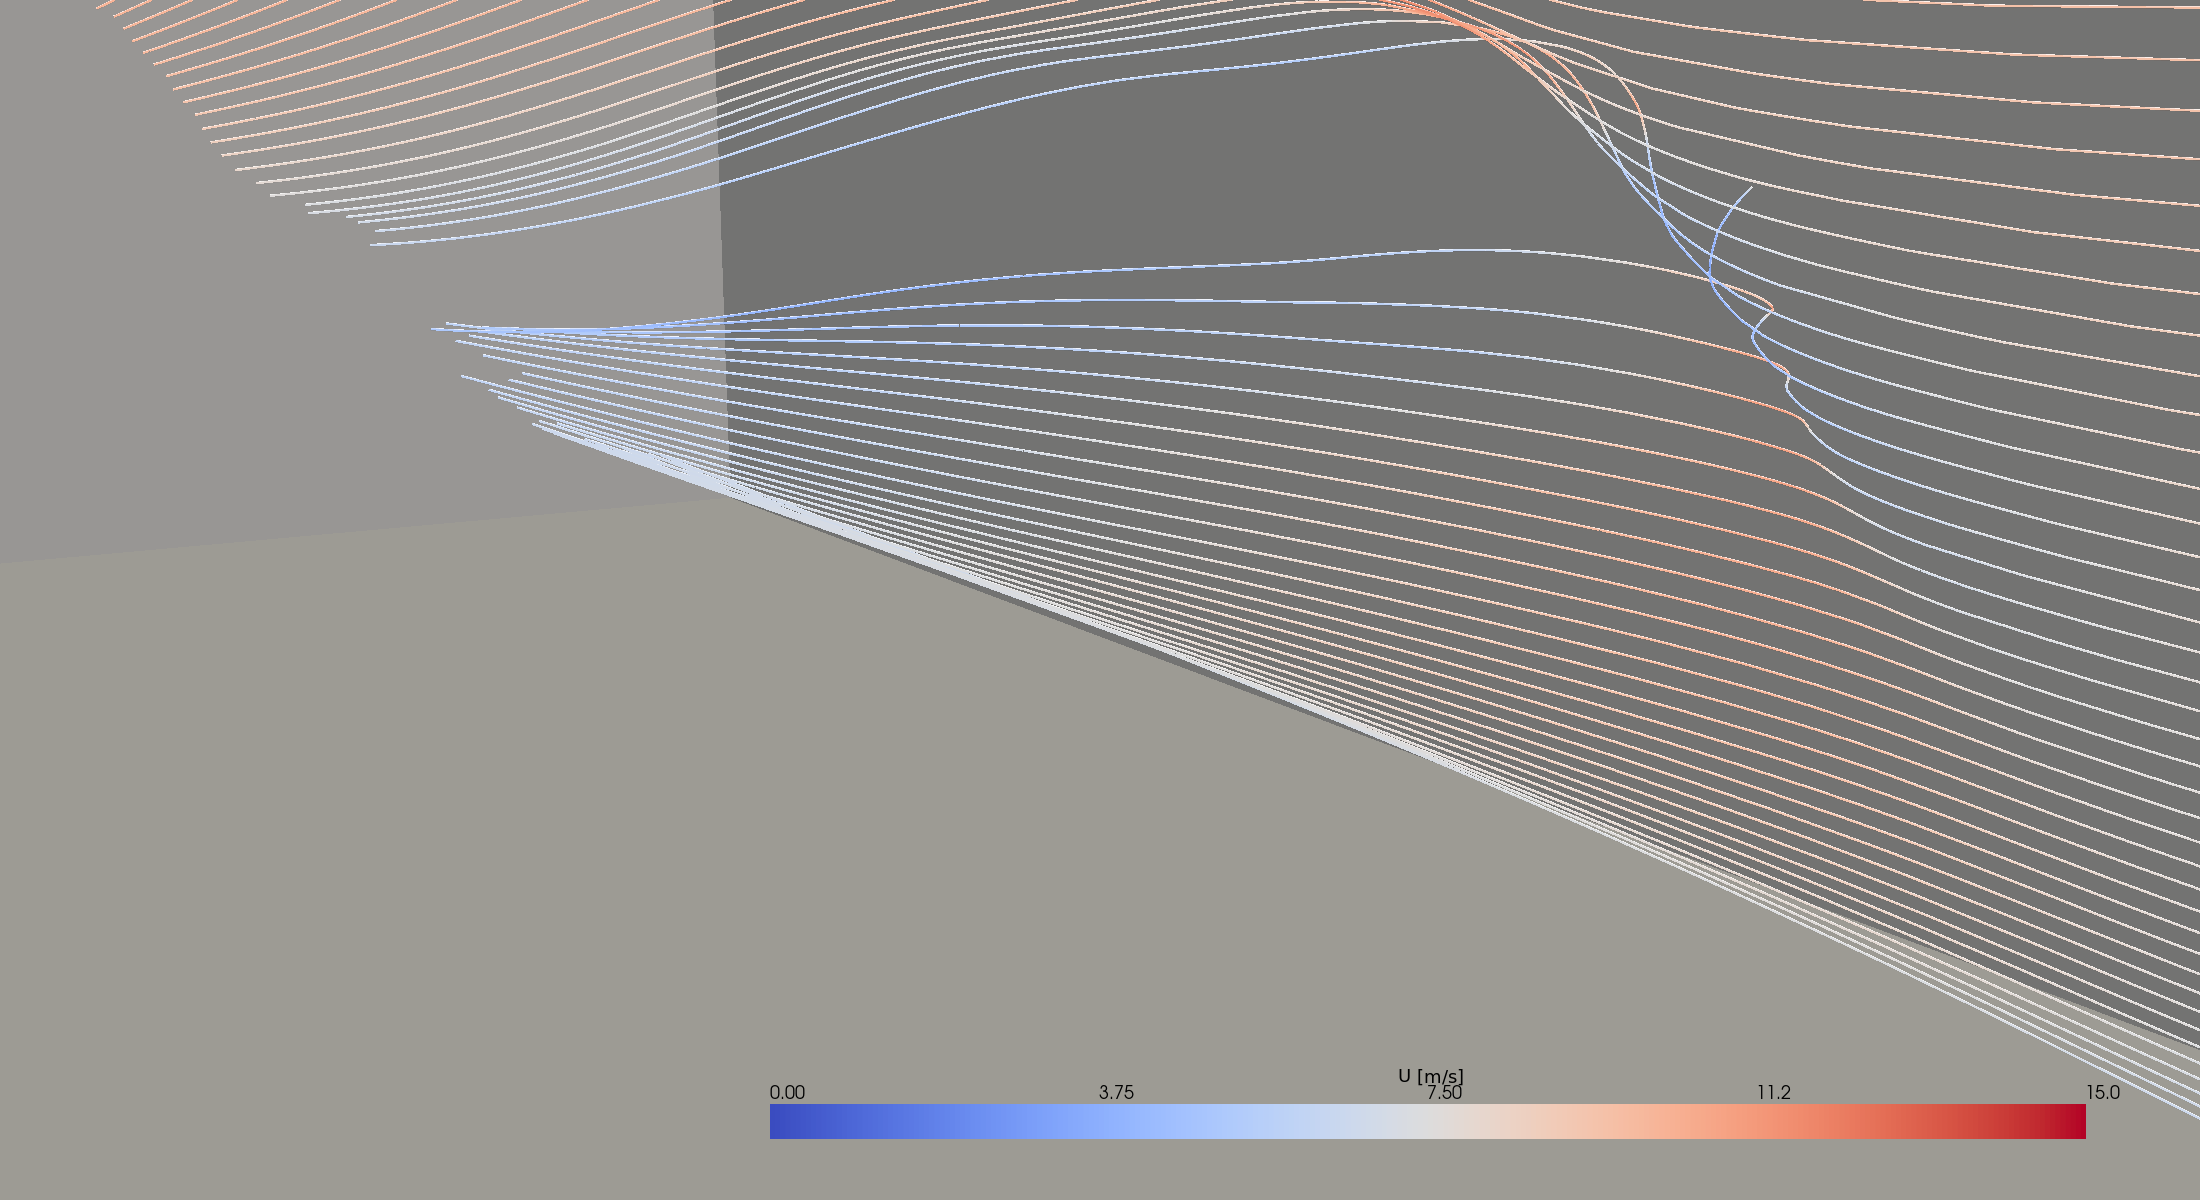
Streamlines seeded from a vertical line upstream of the building trace the complete 3D flow pattern: deflection over the roof, wrapping around the sides, and the low-velocity (blue) trajectories entering the wake recirculation. The colour shift from red (fast, high-altitude) to blue (decelerated, in the wake) makes the energy loss visible.
Why This Matters for Design
| Design decision | What CFD shows |
|---|---|
| Entrance placement | Avoid corners; place in the wake shelter zone |
| Outdoor seating | Only viable in zones with U < 4 m/s (Lawson sitting criterion) |
| Canopy / windbreak sizing | Size to cover the acceleration zone footprint |
| Exhaust stack placement | Avoid the recirculation zone (contaminant trapping) |
| Natural ventilation | Use the windward/leeward Cp difference to drive flow through the building |
| Landscaping | Trees in the acceleration zone reduce the pedestrian-level speed-up |
The Technical Details
| Parameter | Value |
|---|---|
| Solver | simpleFoam (steady RANS, incompressible) |
| Turbulence | Standard k-ε with wall functions |
| Inlet | atmBoundaryLayerInletVelocity (log-law profile, z₀ = 0.1 m) |
| Domain | 330 × 120 × 254 m (10H × 6H × 5H) |
| Cells | 270,108 |
| Convergence | 538 iterations, Ux residual < 1 × 10⁻⁴ |
| Wall time | 8 minutes (single core) |
| Ground | no-slip wall |
| Top / sides | slip |
| Body | no-slip wall |
Scale It Up
This single-building demo runs in minutes. Real projects with multiple buildings, complex terrain, and podium-level detailing scale to 2–5 million cells and run in 1–4 hours on 8 cores — still within a single-workstation budget. AuraMesh handles the mesh complexity; the engineer handles the design decisions.
In this series: Ahmed Body Aerodynamics | Clean Room Airflow | Pedestrian Wind Comfort | Body-Fitted Pipe Meshing | Vortex Shedding Animation