
In a pharmaceutical clean room, air is the product. The laminar downdraft from HEPA ceiling diffusers must sweep contaminants away from the working zone, through the room volume, and out the floor-level returns — uniformly, predictably, and fast.
But you can't see air. You can't see where it stalls, where it recirculates, or where a contaminant released at the wrong time would linger. CFD makes it visible.
The Geometry
A realistic clean room environment: 7.6 × 9.8 × 4.35 m with:
- HEPA ceiling diffuser array (~52 m²) delivering laminar downflow at 0.45 m/s (ISO Class 5 face velocity)
- Floor-level return grilles (6 × ~1 m² each) collecting and exhausting the air
- Secondary gas inlet — a side-wall duct that could introduce a different gas species or temperature
- Internal equipment/platforms that deflect the downdraft
Mesh: 1.23 million cells, auto-generated by AuraMesh in internal-flow mode. The geometry's 68 feature-split patches (inlets, outlets, walls, equipment surfaces) are automatically identified from the STL.
The Mesh
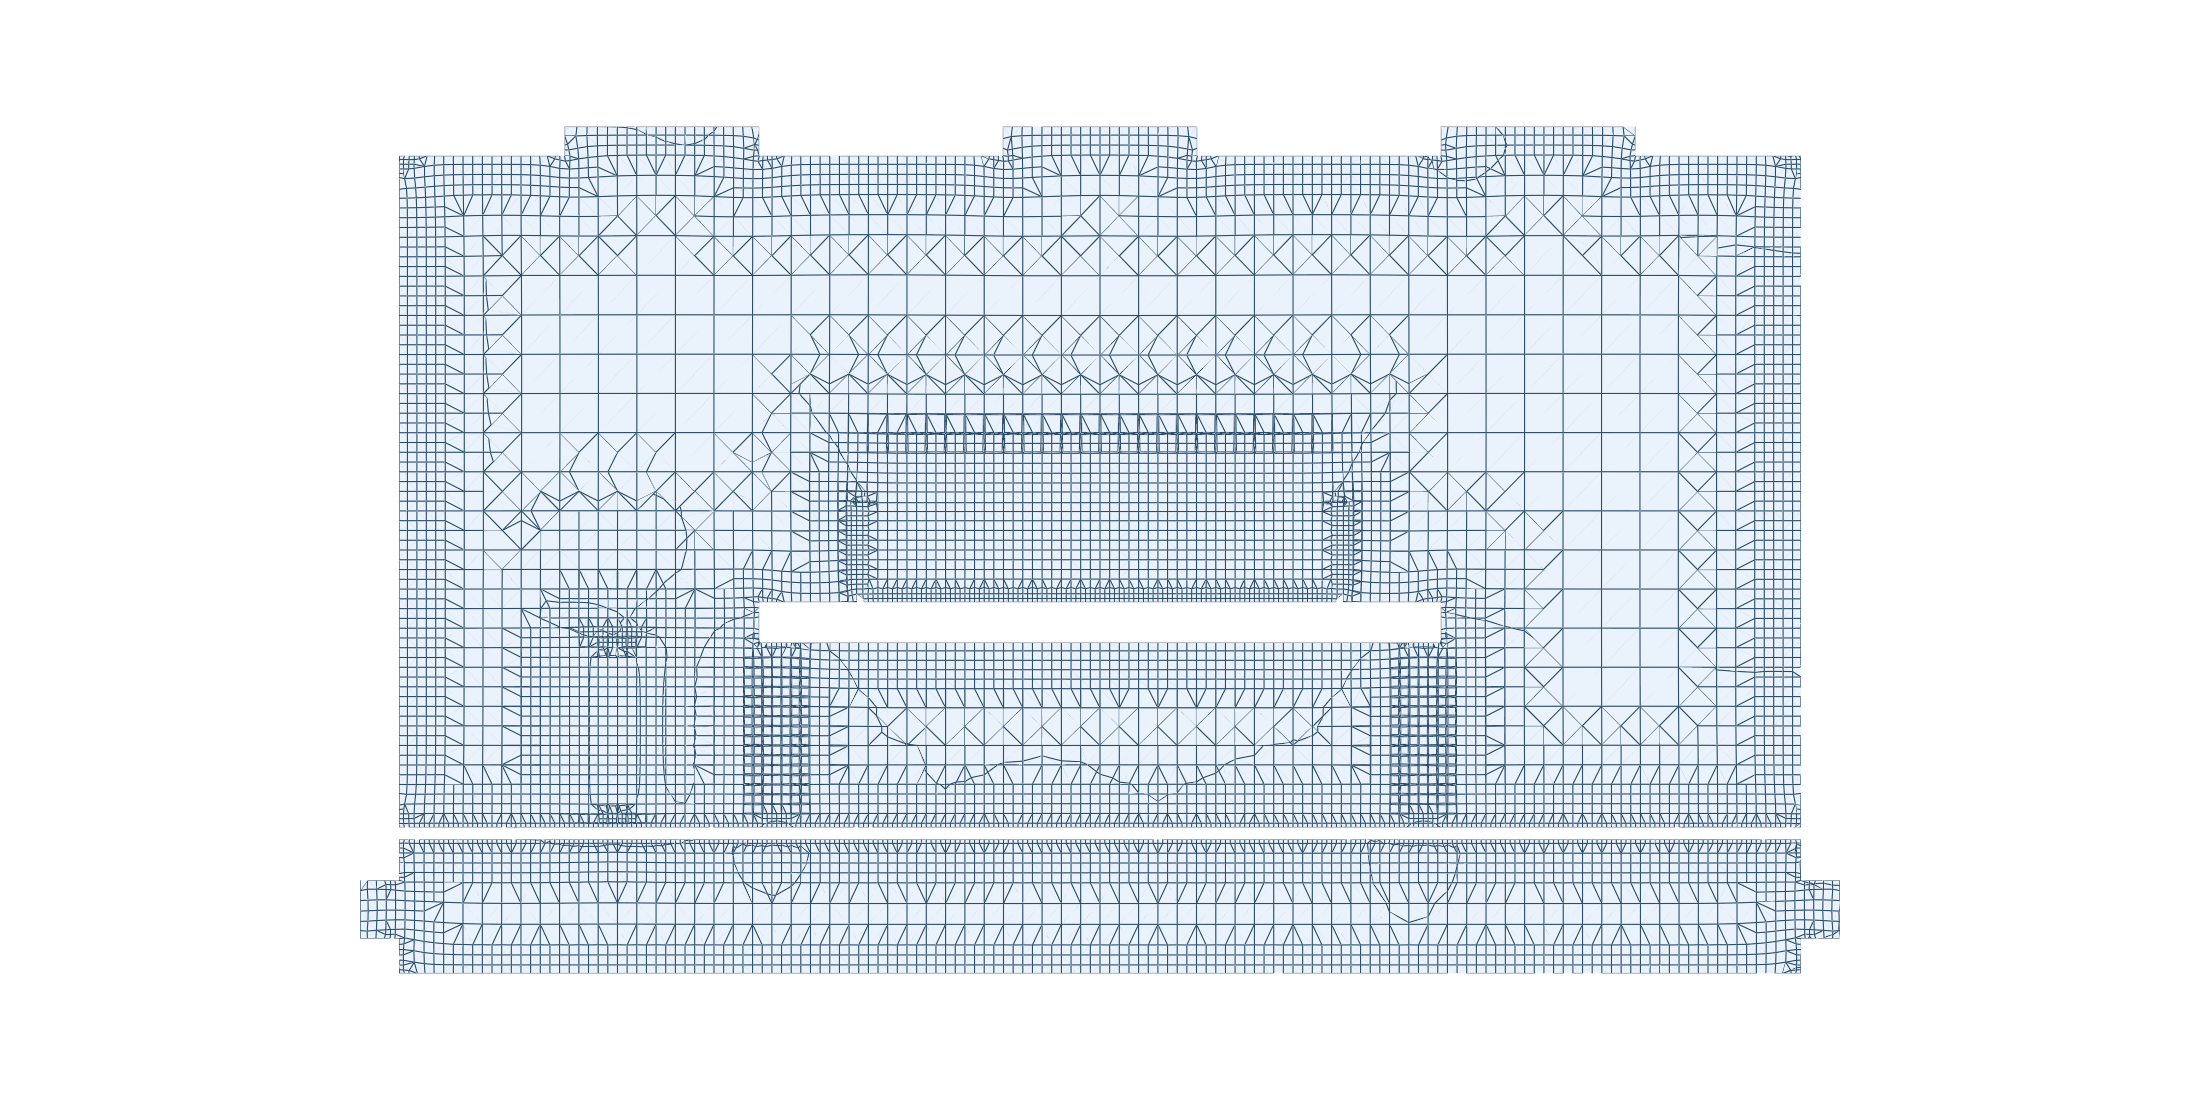
A vertical cut through the volume mesh shows how the discretisation is built: a uniform hexahedral background grid, with progressive refinement layers hugging every solid surface — the ceiling diffuser housings, the internal equipment block, and the floor. The refinement is driven automatically from the STL feature edges, so the near-wall gradients that govern the downdraft and the return-grille acceleration are resolved without any hand-tuning.
Whole-Room Airflow
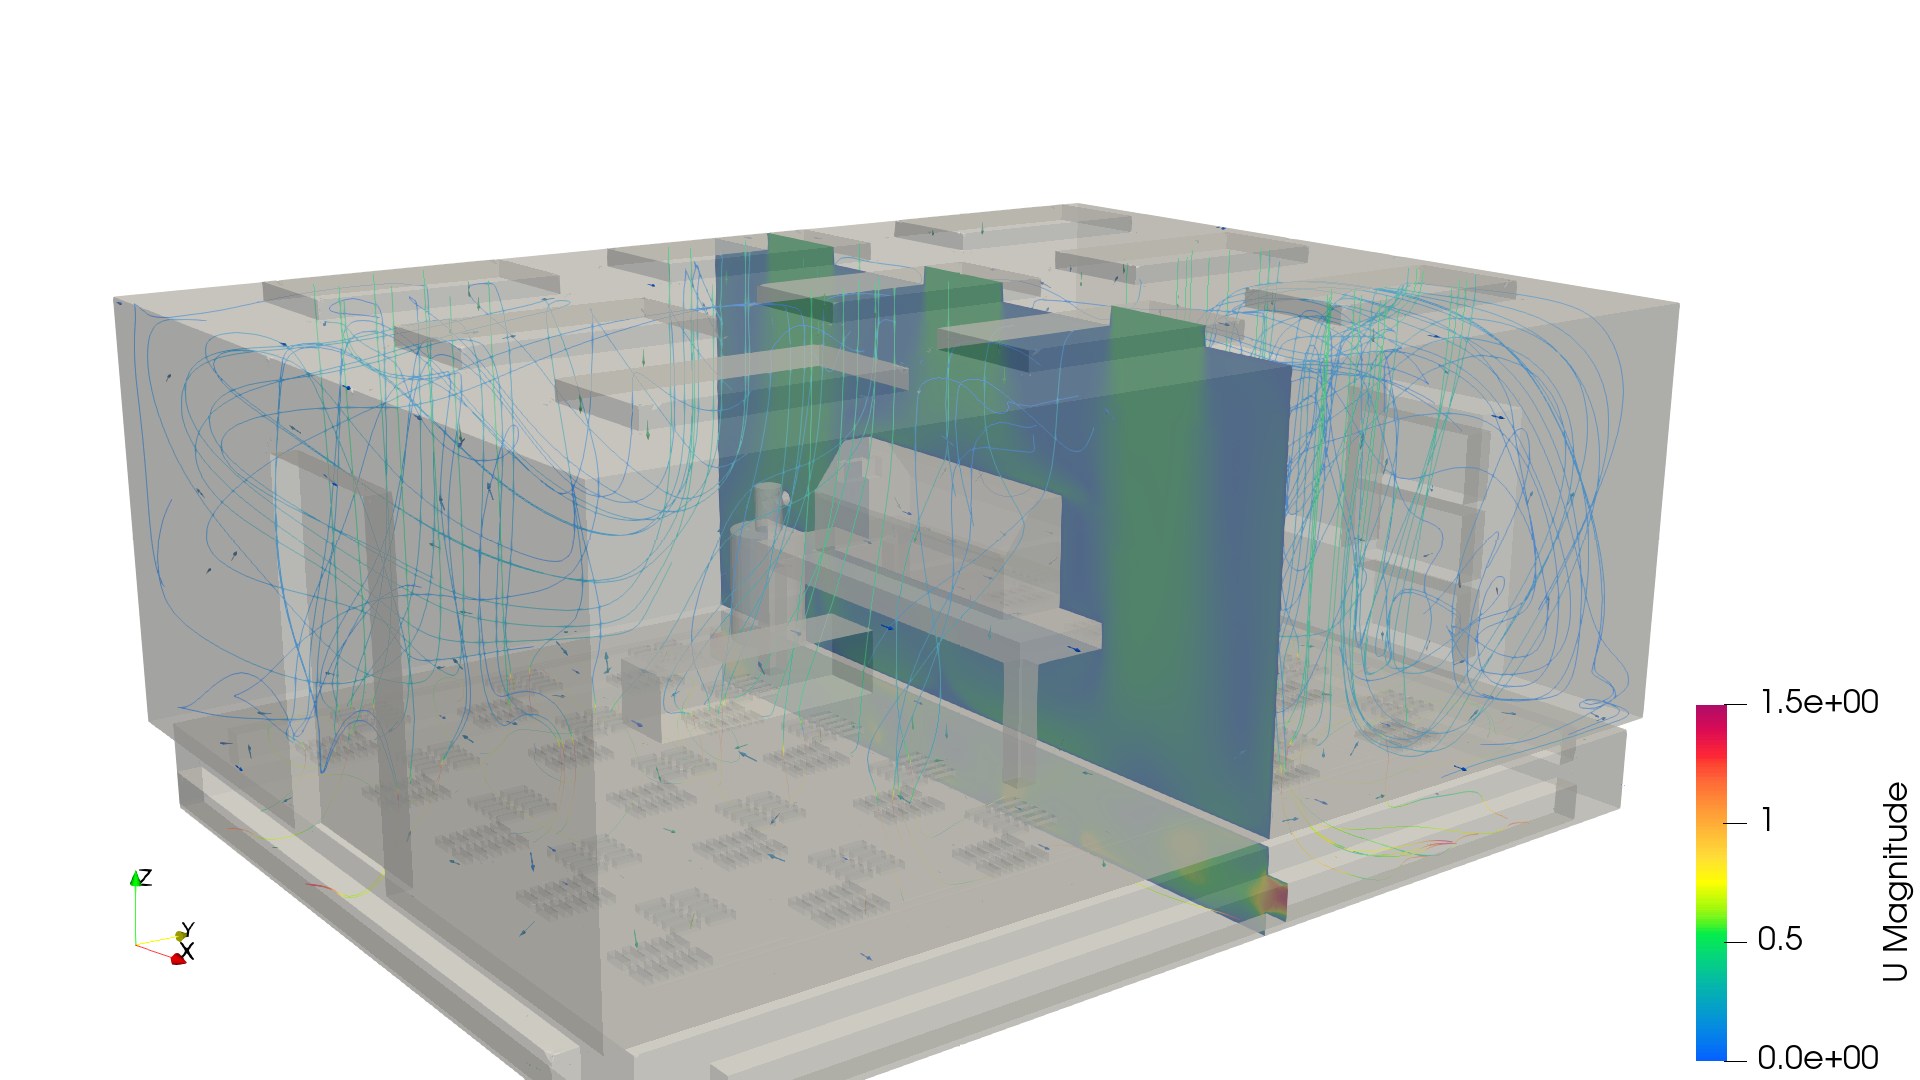
The hero view: the whole room with its walls ghosted out, combining streamlines with two vertical velocity slices through the interior. Filtered air descends from the ceiling and feeds broad, low-speed recirculation loops that wrap down the side walls and along the floor. The central slices show the slow, controlled core (green, ~0.5 m/s) around the equipment — exactly the gentle, uniform environment a clean room is designed to maintain.
Unidirectional Downflow
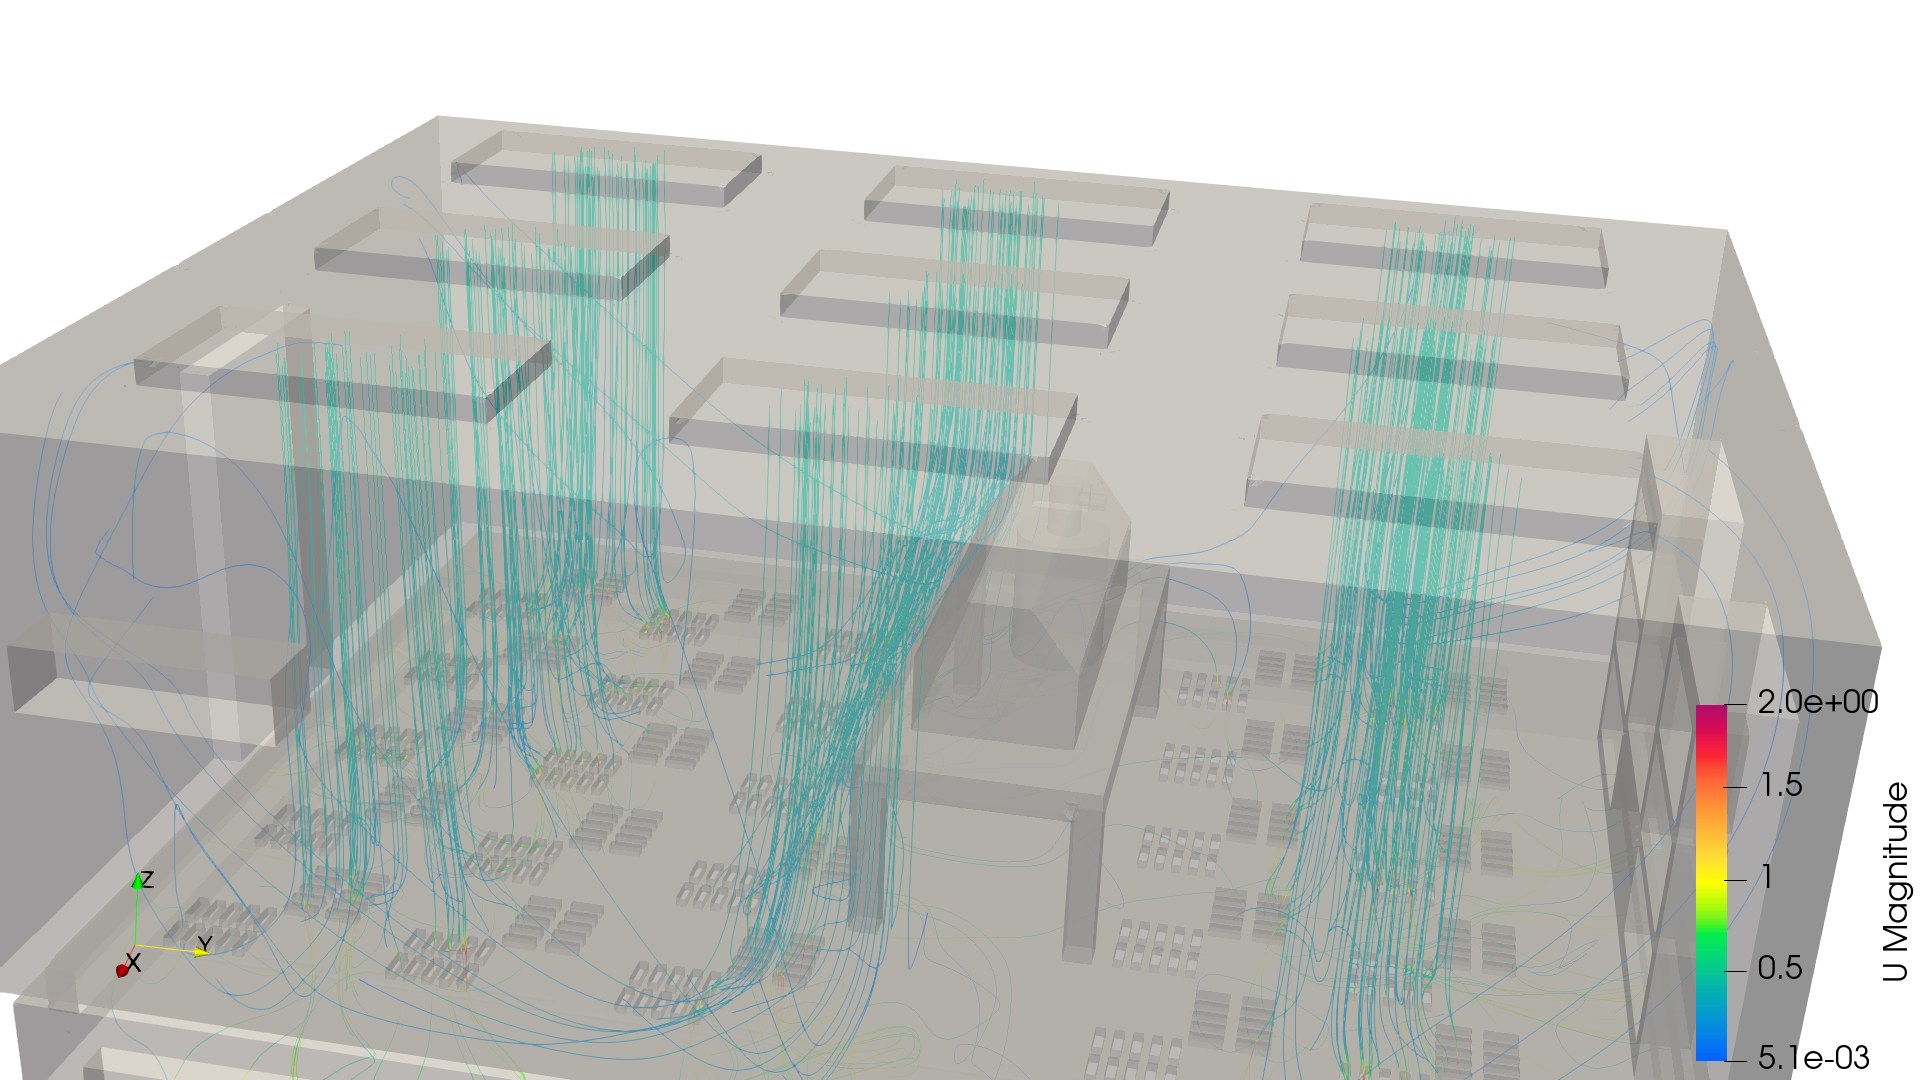
This is the textbook clean-room signature: discrete, near-vertical downdraft columns dropping straight from each HEPA unit to the floor returns. The streamlines stay parallel and slow (teal, well under 0.5 m/s), confirming unidirectional flow with minimal lateral wandering — the property that sweeps particles down and out rather than letting them drift across the work zone.
Under the HEPA Ceiling
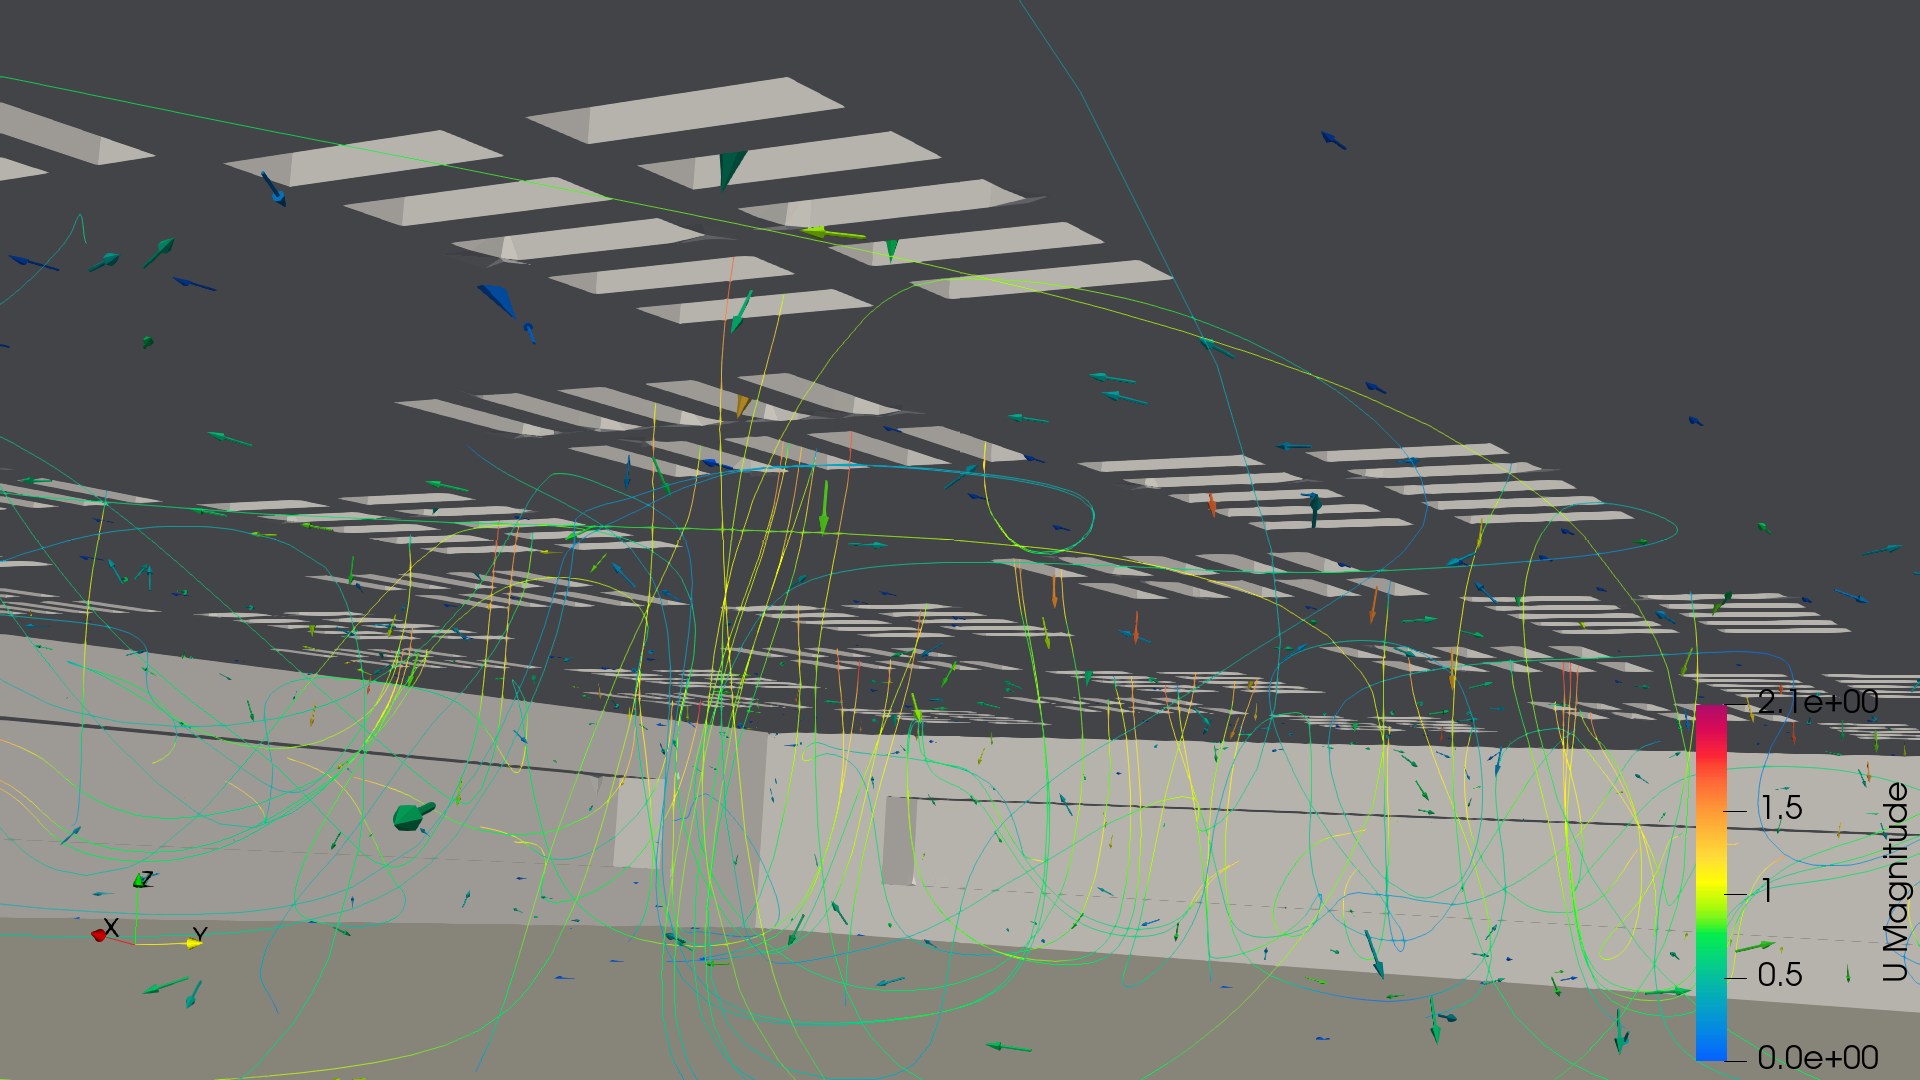
Looking up into the HEPA array itself: the individual filter faces (white rectangles) are the supply, and the streamlines show filtered air peeling off each one and descending into the room. Where the columns interact around obstacles the traces begin to curl — a reminder that even a well-designed ceiling produces some mixing in the occupied zone, which is precisely what the CFD is there to quantify.
Downdraft Impingement and the Floor Returns
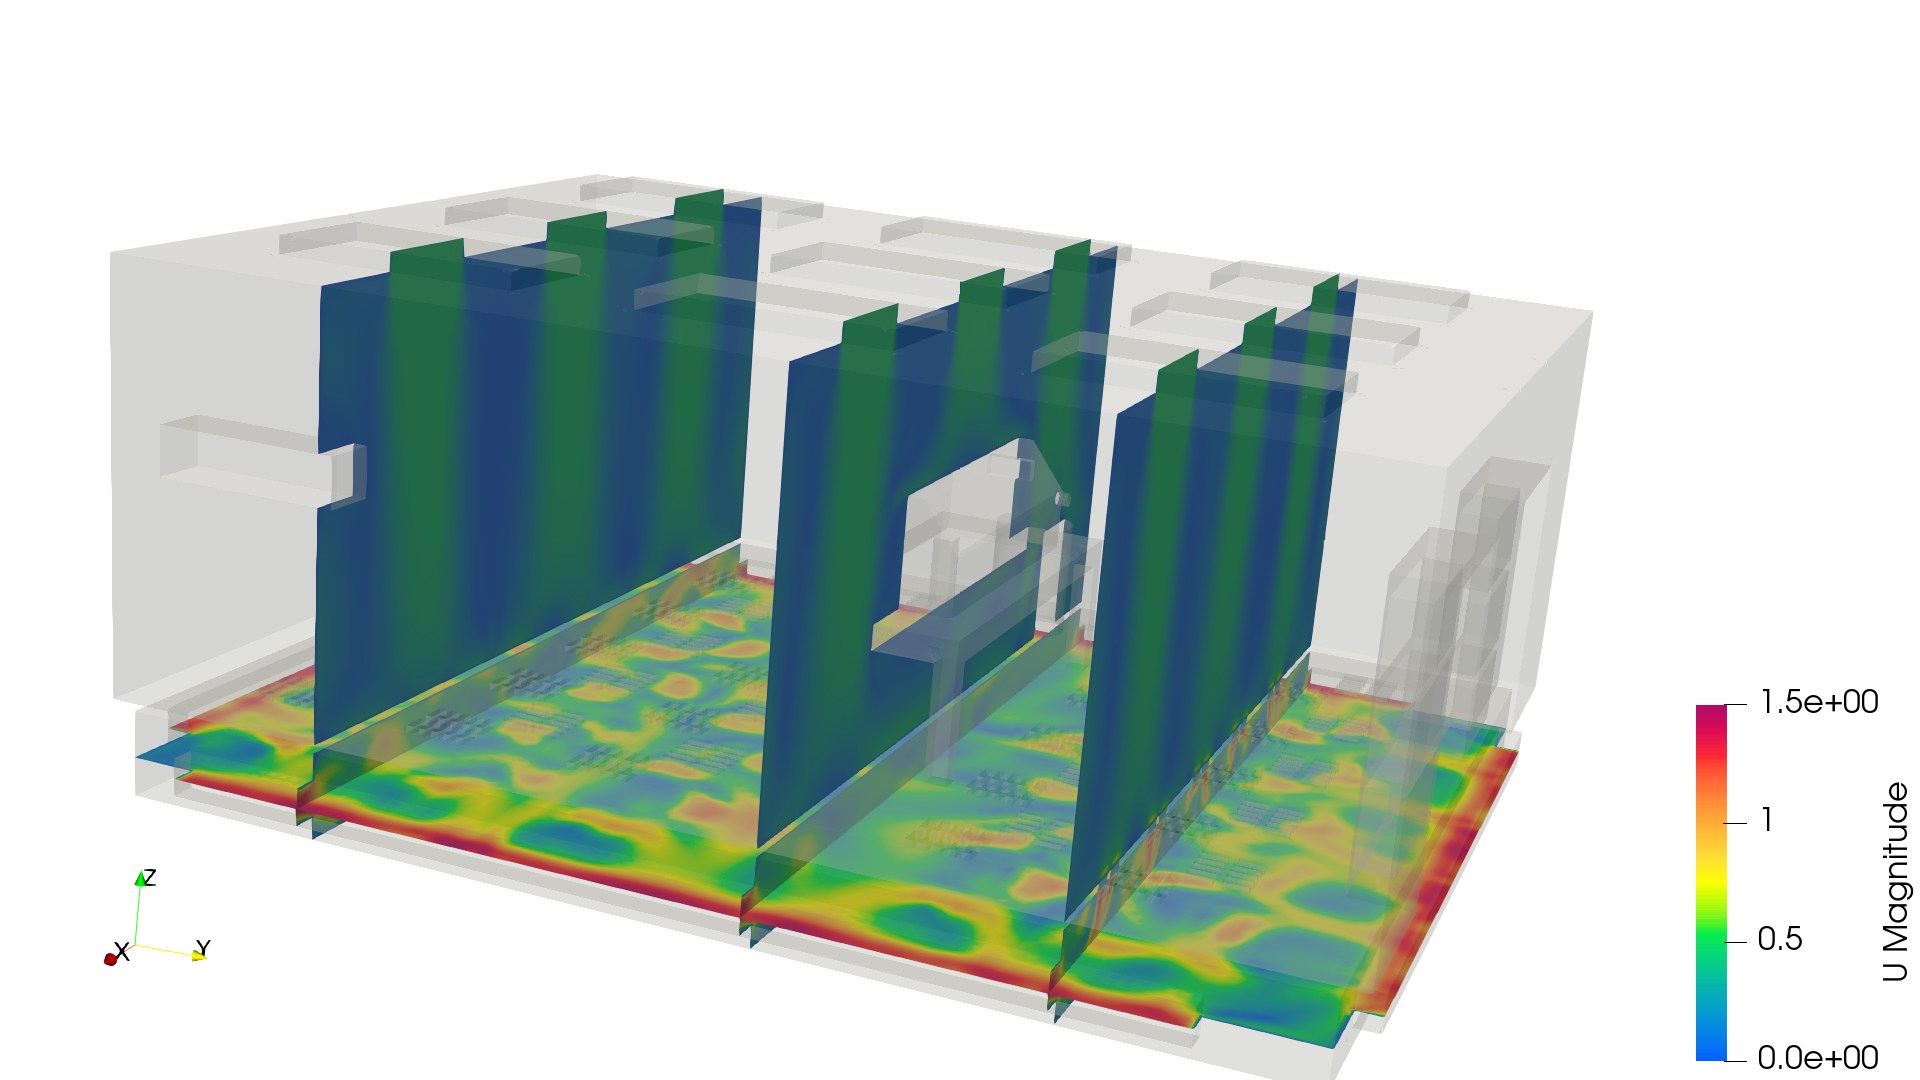
The vertical planes stay cool and uniform (the downflow), but the horizontal floor slice tells the important story: bright green-yellow-red patches mark where each downdraft column strikes the floor and fans outward toward the return grilles. These impingement footprints reveal both the coverage (are the returns catching all the supply air?) and any hot spots that could re-entrain particles.
Side Profile: Downflow and Dead Zones
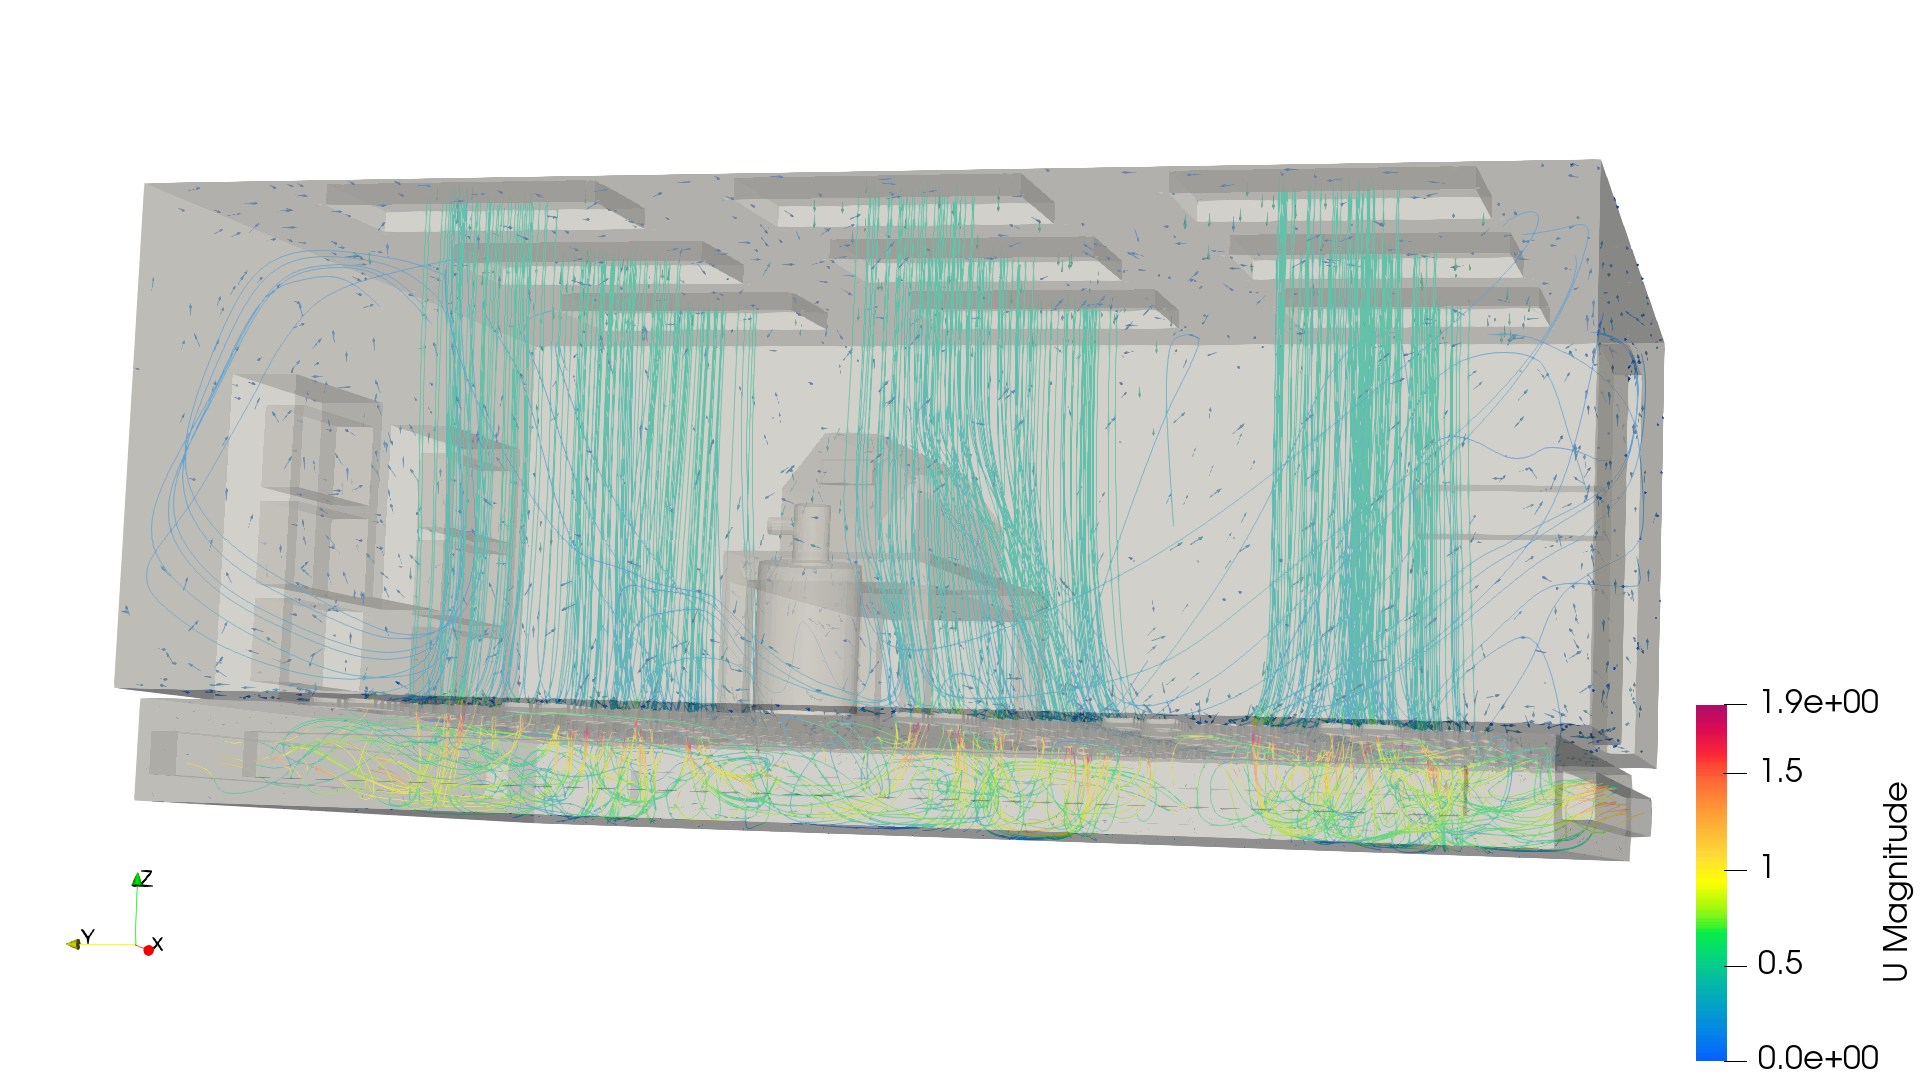
Viewed side-on, the downdraft streaks fill the room centre while a tight curling loop appears beside the equipment — a low-velocity recirculation pocket, or dead zone. Dead zones are where a contaminant would linger longest, so identifying them (and their location relative to the exposed product) is one of the most valuable outputs of the study.
Slice Analysis
The 3D renders show the topology; engineering decisions require quantitative slices.
Vertical Midplane — The Flow Topology
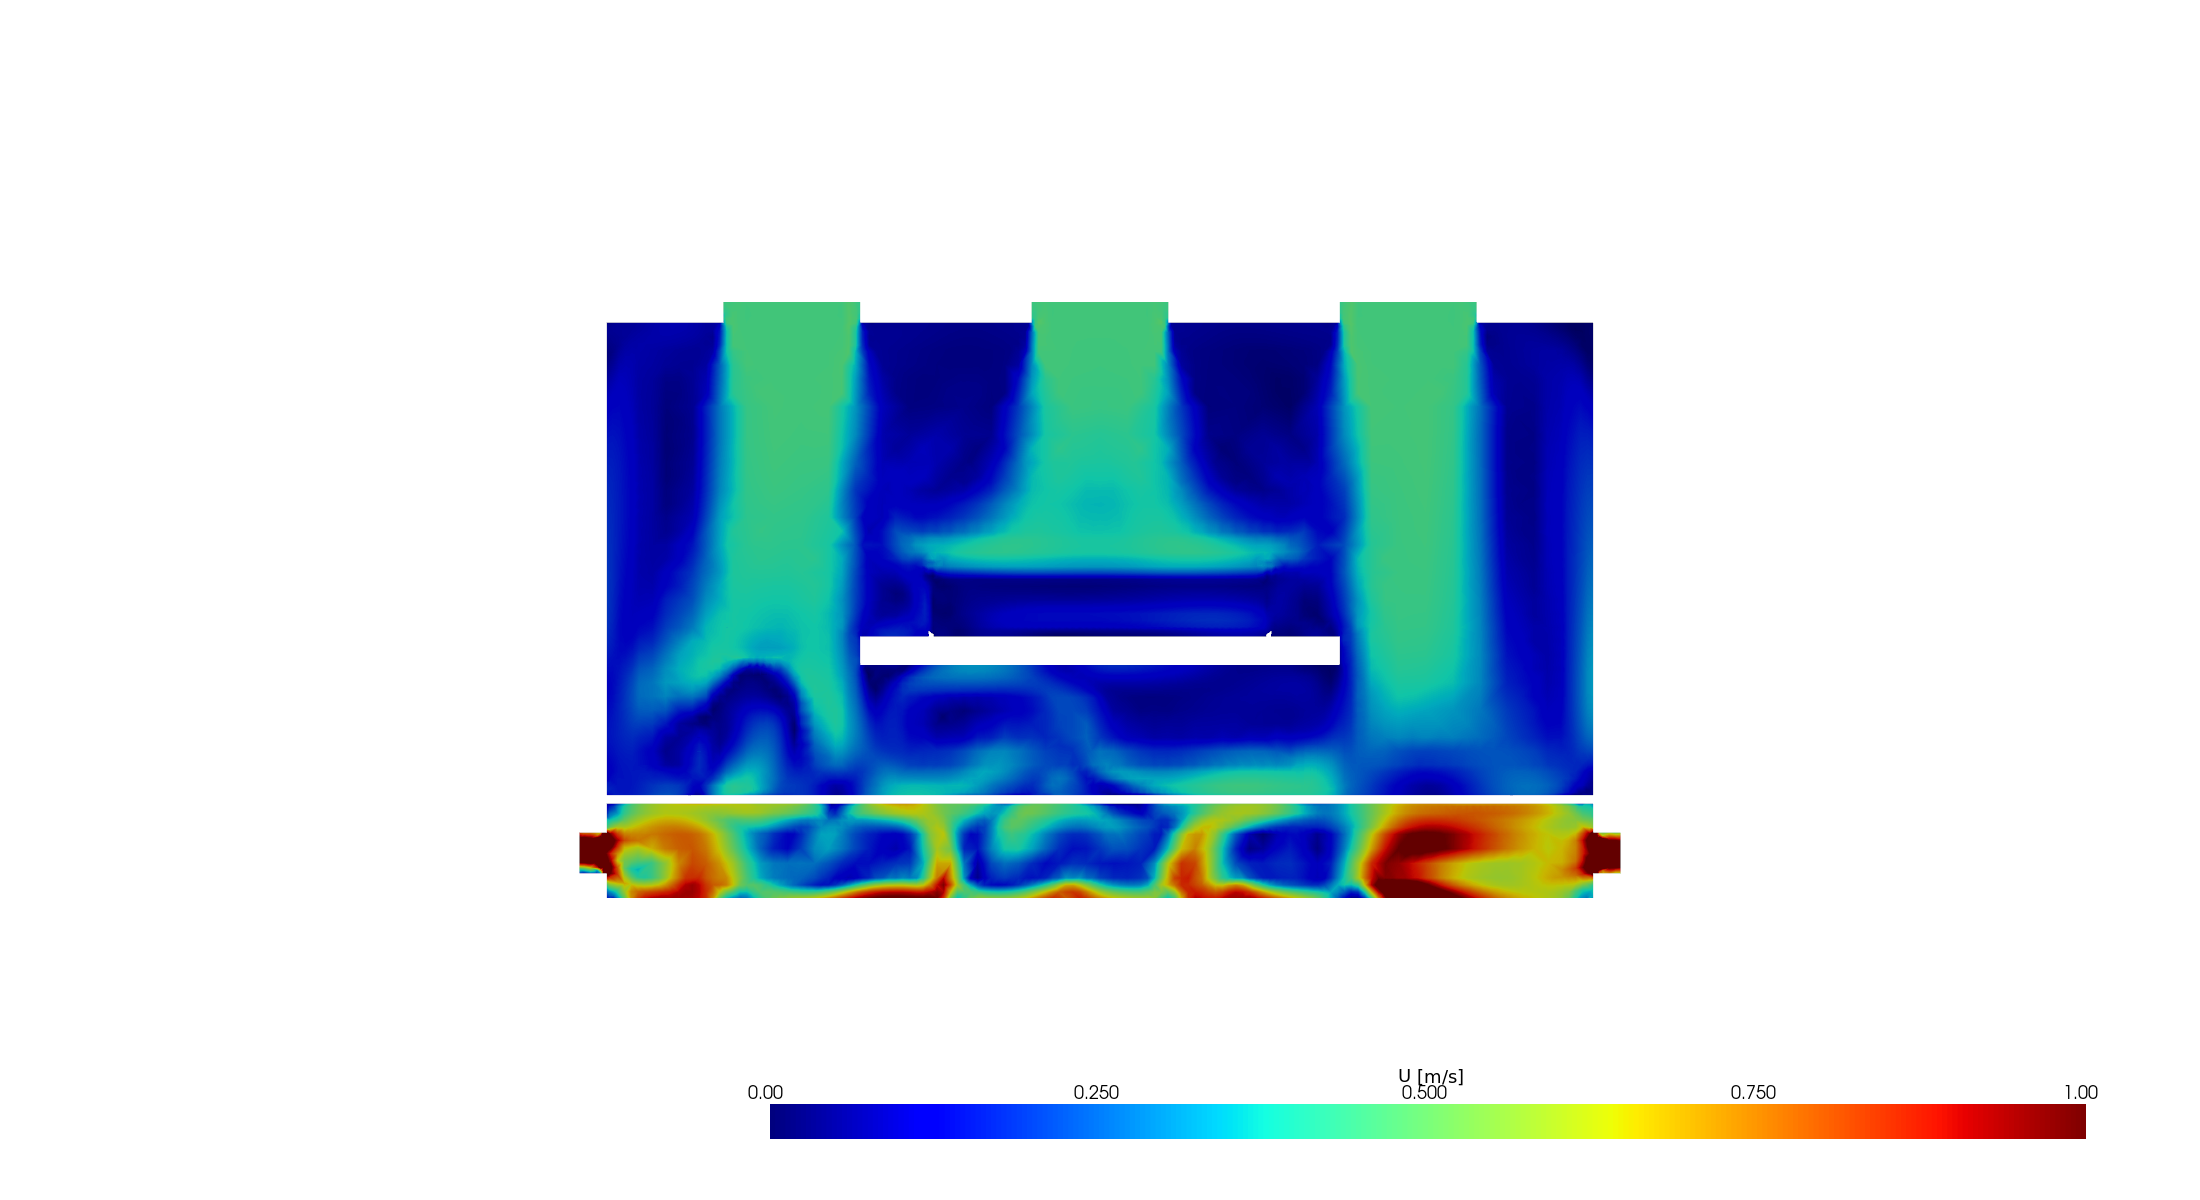
The centerplane reveals:
- Downdraft columns (green, 0.3–0.5 m/s) from the ceiling HEPA array
- Deflection around the internal platform (white void = solid equipment)
- Dead zones (dark blue) between diffuser columns where contamination could linger
- Floor return acceleration (red spots) where air funnels through the grilles
Working Height (z = 1.0 m)
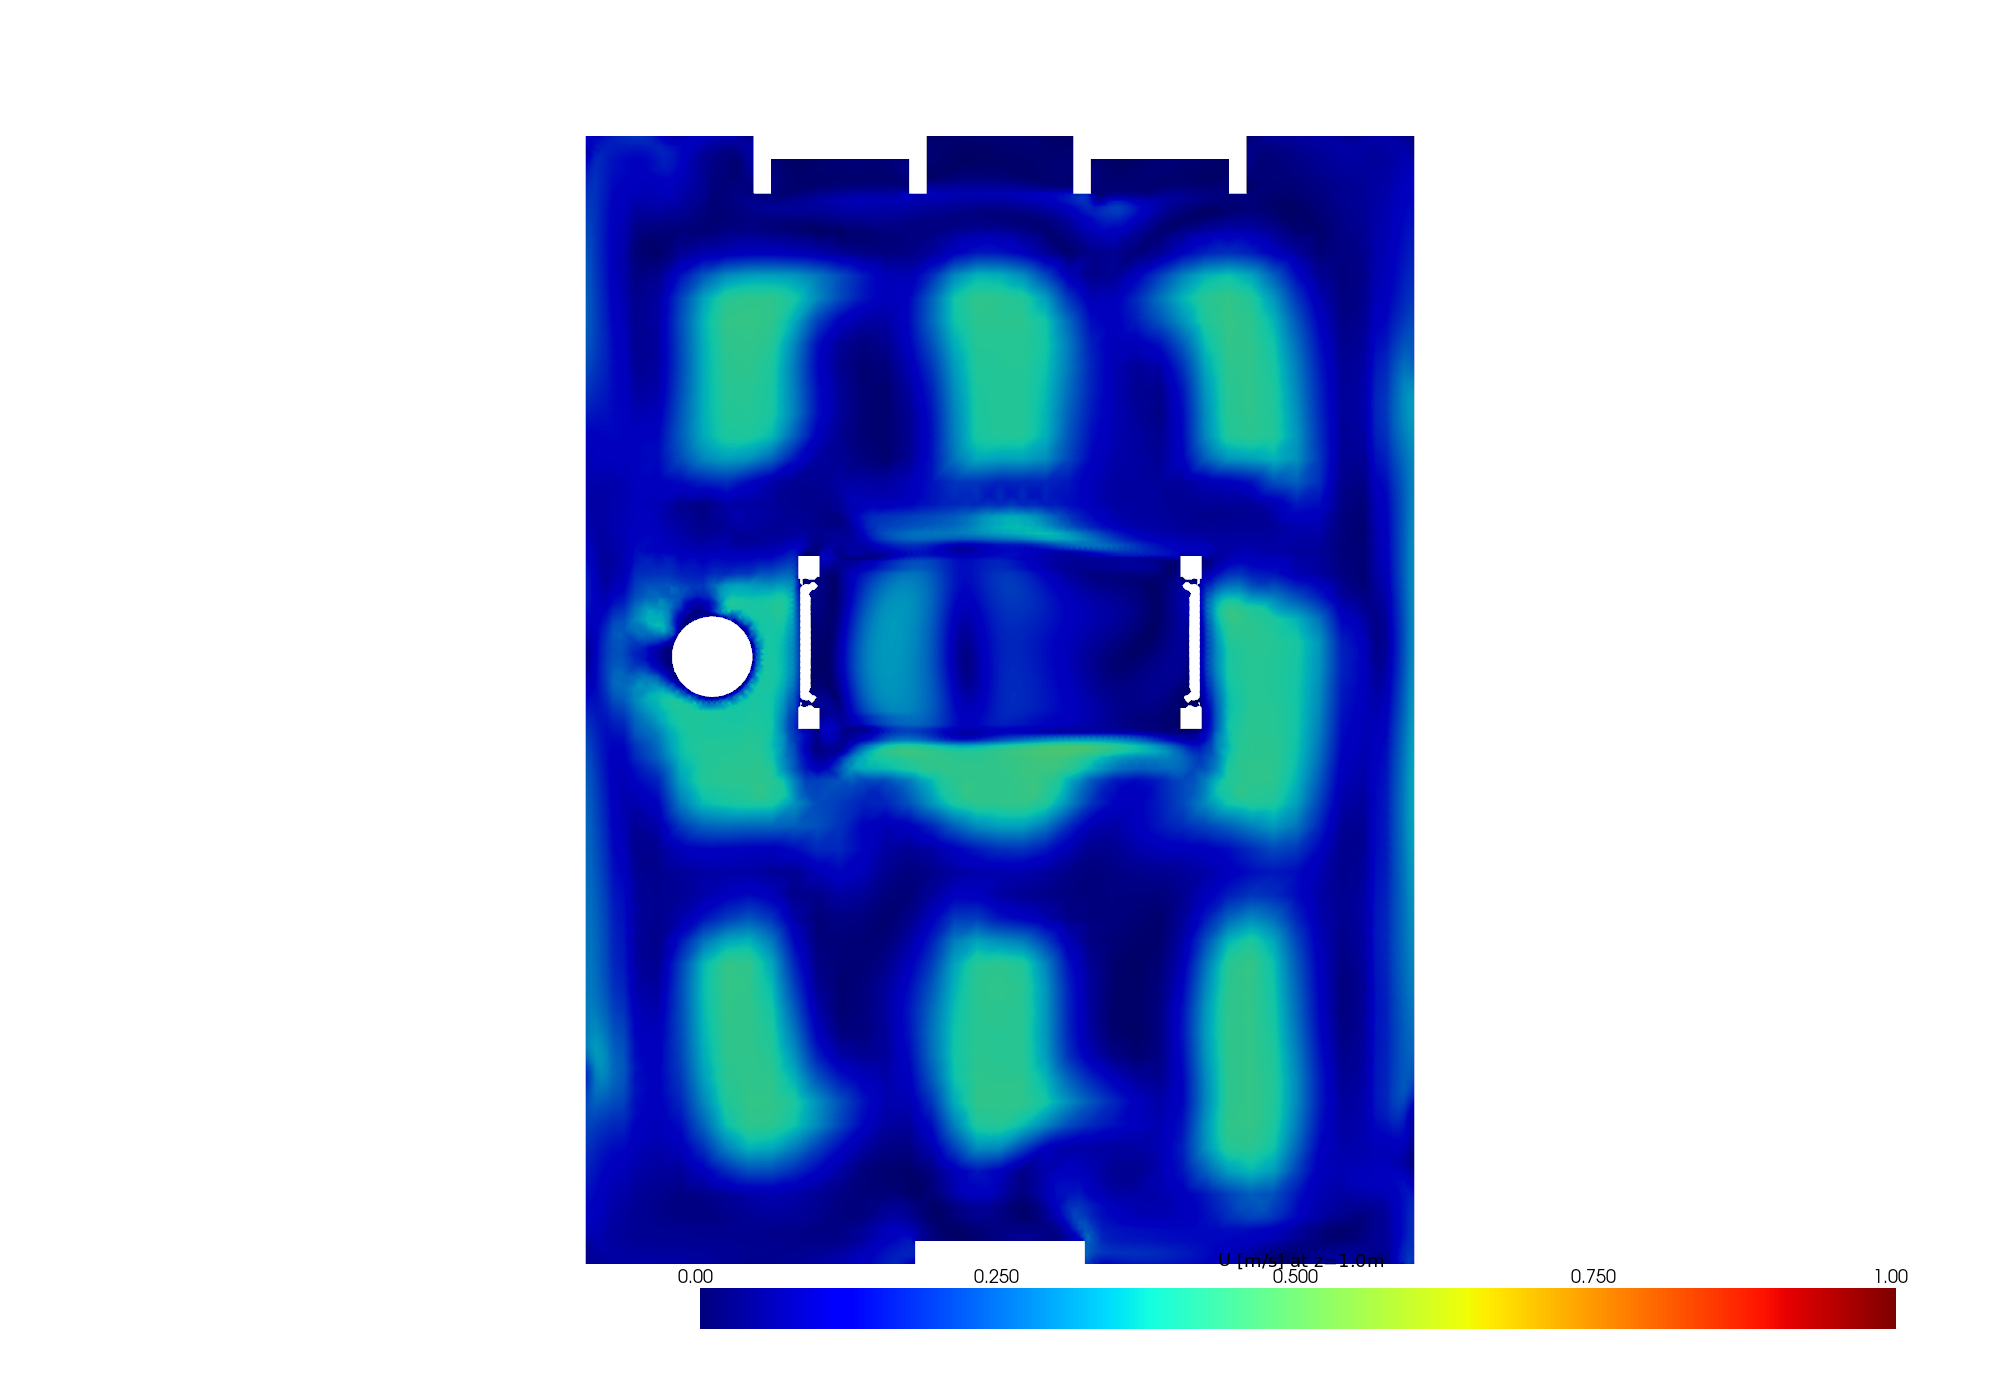
This is the slice that matters for ISO classification: the velocity field at the height where operators work and product is exposed. Uniform blue = good (low turbulence, controlled airflow). Hot spots indicate local jets or equipment-induced turbulence that could transport particles laterally.
The Engineering Questions This Answers
| Question | How CFD answers it |
|---|---|
| Is my downdraft uniform? | Horizontal slice at working height — check for velocity dead zones |
| Where would a contaminant linger? | Dead zones (near-zero velocity) on the slice = long residence time |
| How fast is a gas purged? | Add a passive scalar at the secondary inlet, track volume-average decay |
| Does equipment placement disrupt laminar flow? | Streamlines show deflection and recirculation around internal objects |
| Do my returns have enough capacity? | Floor-grille velocity (red spots) should match the target face velocity |
From Geometry to Insight: The Pipeline
No manual meshing. No dictionary editing. The feature-split automatically names inlets, outlets, and wall patches from the STL solid names. The engineer focuses on what the simulation means, not on how to make it run.
What's Next: Contamination Purge Timing
The steady-state flow field is the foundation. The next step: freeze the velocity field and run scalarTransportFoam with a passive tracer initialized at unit concentration everywhere. Clean supply air (T=0) enters from the HEPA and the secondary inlet; the volume-averaged tracer concentration decays exponentially. The purge time — when concentration drops below 1% — is the engineering deliverable.
That's a follow-up blog. Stay tuned.
In this series: Ahmed Body Aerodynamics | Clean Room Airflow | Pedestrian Wind Comfort | Body-Fitted Pipe Meshing | Vortex Shedding Animation